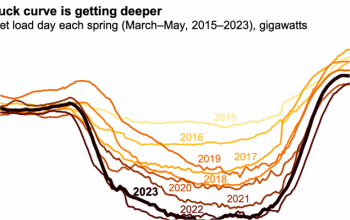
 California Power Load "Duck Curve" Increasingly Prominent!
Jun 26, 2023
According to the U.S. Energy Information Administration, as solar generation has increased in California, the grid operator of the California Independent System Operator (CAISO) has seen net load (the remaining demand after subtracting variable renewable energy generation) decline on days when solar generation tends to be at its highest. When charting the load for a typical day, it can be seen that the net load curve drops sharply in the middle of the day and then rises sharply in the evening when the solar generation drops, so that the curve formed looks like the outline of a duck, so this pattern is often referred to as the "duck curve". As California's solar generation continues to grow, the decline in midday net load is increasing, creating challenges for grid operators. Grid operators need to balance a region's generation and electricity demand at all times. Demand is lowest overnight, when most consumers are sleeping and many businesses are closed. In the morning, as people wake up and businesses open for business, demand starts to increase. Demand kept rising throughout the day, rising slightly in the evening as people returned home from work and residential electricity use increased, then falling again late at night. However, unlike conventional power plants, such as nuclear, coal and natural gas plants, solar and wind resources cannot be deployed at will to meet demand, and utilities have at some point had to cut back on these resources to protect grid operations. Solar energy is generated only during the day, peaking at noon when the sun is at its strongest and waning at sunset. As more solar capacity comes online and conventional power plants are used less frequently in the middle of the day, the duck curve becomes more pronounced. The duck curve implies two challenges associated with the increased use of solar energy. The first challenge is the strain on the power grid. Demand for electricity from conventional power plants fluctuates dramatically from midday to late at night, when energy demand is still high, but solar generation has declined, meaning that conventional power plants (such as natural gas plants) must rapidly increase electricity production to meet consumer demand. This rapid growth makes it harder for grid operators to match grid supply and grid demand in real time. In addition, if the amount of solar energy produced exceeds the amount used by the grid, operators may have to reduce solar power generation to prevent over-generation. The other challenge is economic. The dynamic nature of the duck curve can challenge the traditional economics of dispatchable power plants because the factors that lead to the curve reduce the operating time of conventional power plants, resulting in reduced electricity revenue. If the loss of revenue makes plant maintenance uneconomical, the plant may be decommissioned without a dispatchable replacement. In systems where net demand fluctuates greatly, the reduction in dispatchable power make...
View More
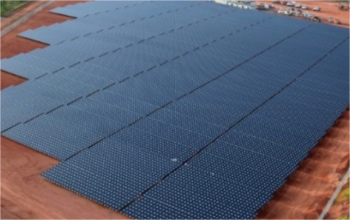 This Company Will Build A Solar Power Plant In A Diamond Mine!
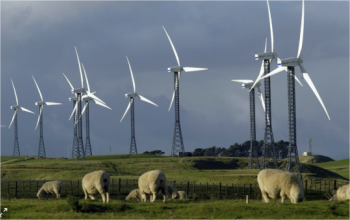 The New Zealand Government Has Established A $1.2 Billion Fund To Promote 100% Renewable Energy Generation
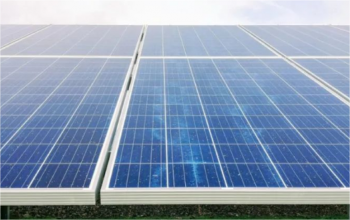 UK Developer Acquires Largest Photovoltaic Project iIn Bulgaria
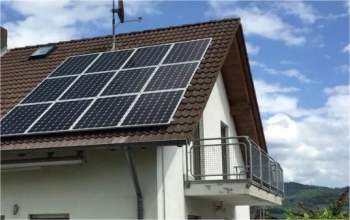 Germany Installed 6.26GW Of Solar Power In The First Half Of The Year
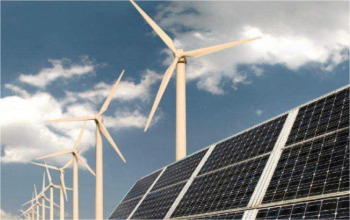 US Solar Contract Prices Have Fallen For The First Time In Three Years
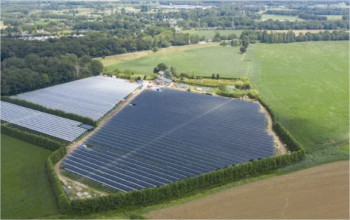 The Photovoltaic Industry Met 18.9% Of The Netherlands' Electricity Demand In The First Half Of The Year
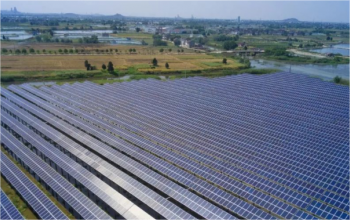 In The First Half Of 2023, 50% Of Germany's Electricity Will Come From Renewable Sources!
 California Power Load "Duck Curve" Increasingly Prominent!
 Serbia Has Launched Its First Auction Of Renewable Energy Projects, Allocating 50MW Of Solar Projects
 France Added 601MW Of Photovoltaic Installations In The First Quarter